EPIQ pools all essential property data into one platform
- A tool to easily visualise data and produce a customised dashboard.
- Access to the most up-to-date supply, demand and price data to get ahead of the market.
KUALA LUMPUR (Dec 8): Accurate and up-to-date data is key to making deft decisions when it comes to property investments, be it for buyers or developers. Hence, prudent investors spend tons of time and effort in scouring an array of avenues to get a comprehensive hold of facts and figures before signing on any commitments.
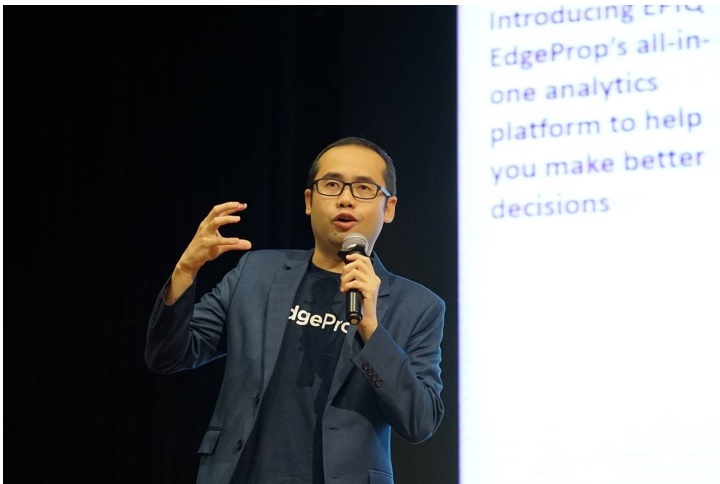
However, while such information is readily available online, a common frustration is the data from different channels are disjointed and fragmented, making it difficult to be employed for decision-making, said EdgeProp managing director Alvin Ong.
“This is why over the past months, EdgeProp has established an all-in-one analytics platform, or EPIQ in short,” he said.
“If you go online, it will take some time to gather all the information. On EPIQ, you will be able to pull in the exact insights you want … making it simple for you,” Ong noted.
The latest property intelligence tool developed by EdgeProp is a centralised platform with data from various sources – from the country’s, industry’s or even the hyperlocal perspectives.
“By combining advanced analytics and visualisation, it is now possible for developers and even agencies to paint more vivid pictures of supply and demand, and harness that information for quick actionable insights,” he said during a presentation at the Property Development: Head of Sales Industry Brainstorming for 2023 organised by the Real Estate and Housing Developers' Association Malaysia (Rehda) recently.
Customised, comprehensive and convenient
Ong’s presentation, entitled Looking beyond averages: Supply & demand trends in KL & Selangor also gave a glimpse of how EPIQ could extract data on rental yields and property market trends of specific areas, and how these could be integrated to provide a fuller analysis for the user.
Another superior feature on EPIQ is Map PRO, which includes segments such as Cadastre or Lot Numbers with Ruler Function; Zoning or Land Use; Price and Volume Heatmaps; and Topography.

“We have also created a customised dashboard for you to check the evolution of sale and rent prices – from an area level all the way to project or even national level.
“So, you’ll be able to see their unit and size distributions, and if you are weighing potential market strategies, you can look at price comparisons with other similar projects in the area.
“We know that different developers have very different needs … so we are not trying to set up a ‘one-size-fits-all’ solution,” he said, pointing out that EPIQ makes it easy for individuals to build a portfolio of their based on state, district and down to property type.
“No matter how you slice and dice the data, you can do it based on the exact hypothesis you want to test,” Ong said.
However, he cautioned data analytics would not serve as a crystal ball as it would need certain experience and expertise to decipher the findings.
“The best way to use data is not to make a decision from it, but to use it to validate your understanding of the industry. It can only serve to support your hypothesis, not generate a hypothesis for you,” he said.
Thus, the EPIQ tool could be leveraged to generate data to test an informed hypothesis and challenge conventional intuitions, thereby prompting you to think twice and consider some of the elements that may have been overlooked.
“EPIQ can help you sift through the noise to understand what matters most,” Ong stated.
Those interested can email [email protected] for a demonstration.
Follow Us
Follow our channels to receive property news updates 24/7 round the clock.
Telegram

Latest publications
View AllFollow Us
Follow our channels to receive property news updates 24/7 round the clock.
Malaysia's Most
Loved Property App
The only property app you need. More than 200,000 sale/rent listings and daily property news.
