ADVERTISEMENT
All Property News
Stay updated with the latest real estate and finance news, including property market trends, housing insights, and valuable information.

Citaglobal extends deadline for Zeqna, Koridor Mentari stake acquisitions
Yesterday

Berjaya Property details RM1.30 bil funding breakdown for tyre manufacturing plant
Yesterday

Talam Transform shareholders reject all 14 resolutions to block board changes
Yesterday
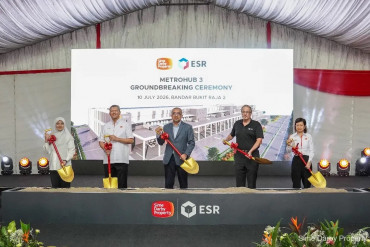
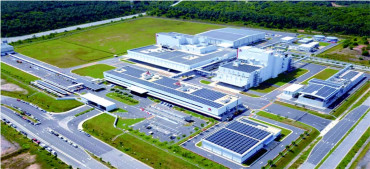
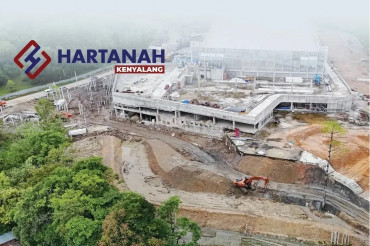
Sime Darby Property, ESR add two logistics facilities with 2.2 million sq ft in Klang
Jul 10, 2026
Evolving with the tide: How real estate family offices can navigate the shift from developer to institutional investor
Jul 10, 2026

Selangor eyes September groundbreaking for Carey Island port, reviews potential operators
Jul 10, 2026


![[Branded] Step inside the landscapes of S P Setia townships with the EdgeProp-S P Setia photo contest](https://media.edgeprop.my/s3fs-public/styles/simplecrop/public/field/image/sttownship4.jpeg)


.jpg?sCKFImEqUesBHXT_lIvjplKjBWFpqpUp)


Shorts
View All
In an alternate universe this would've been their career!

A little throwback to EdgeProp Malaysia's Realtor's Roundtable Awards 2025✨️

Bangsar is still one of KL’s most desirable suburbs— but what’s driving demand today?

This central business district is redefining Kuala Lumpur's skyline and strengthening Malaysia's position as a leading business hub. With Grade A offices and premium retail spaces, this is where experts say the future of commercial real estate is taking shape.

Keep watching for a plot twist


Malaysia's Most
Loved Property App
The only property app you need. More than 200,000 sale/rent listings and daily property news.
